The puzzle
Randi et al. (2023) stimulated single neurons in 110 C. elegans with light, one at a time, and recorded how the rest of the brain responded: 5,618 stimulation events. Average those responses over animals and you get a causal map: for each pair of neurons, how much the second one moves when the first is stimulated.
The worm is also the animal with the most complete wiring diagram. So the natural expectation is that the map should follow the wiring: stimulate a neuron, and the signal flows along its synapses. A 2025 model by Creamer, Leifer and Pillow, constrained to the connectome, was reported to capture most of the map’s reproducible signal.
The question I worked on is simpler and harder to fake: in a worm the model has never seen, how much of the causal map can be predicted, and where does that information come from? From the wiring? Or just from knowing which neuron is which, and how that neuron behaved in other worms? It is hard because the measurements are noisy (a few stimulation events per pair), because a large share of each worm’s response is its own, and because the standard score turned out to reward predicting the worm’s ongoing activity rather than the effect of the stimulus.
The code and result files live in a private repository; every number on this page is traced to a result file in the investigation log below. A sibling project on the same machine asks a different question of learners rather than of worms: Where an inference law lives, on the split between a prior, an inference made in state, and a write into structure.
The investigation
What survived
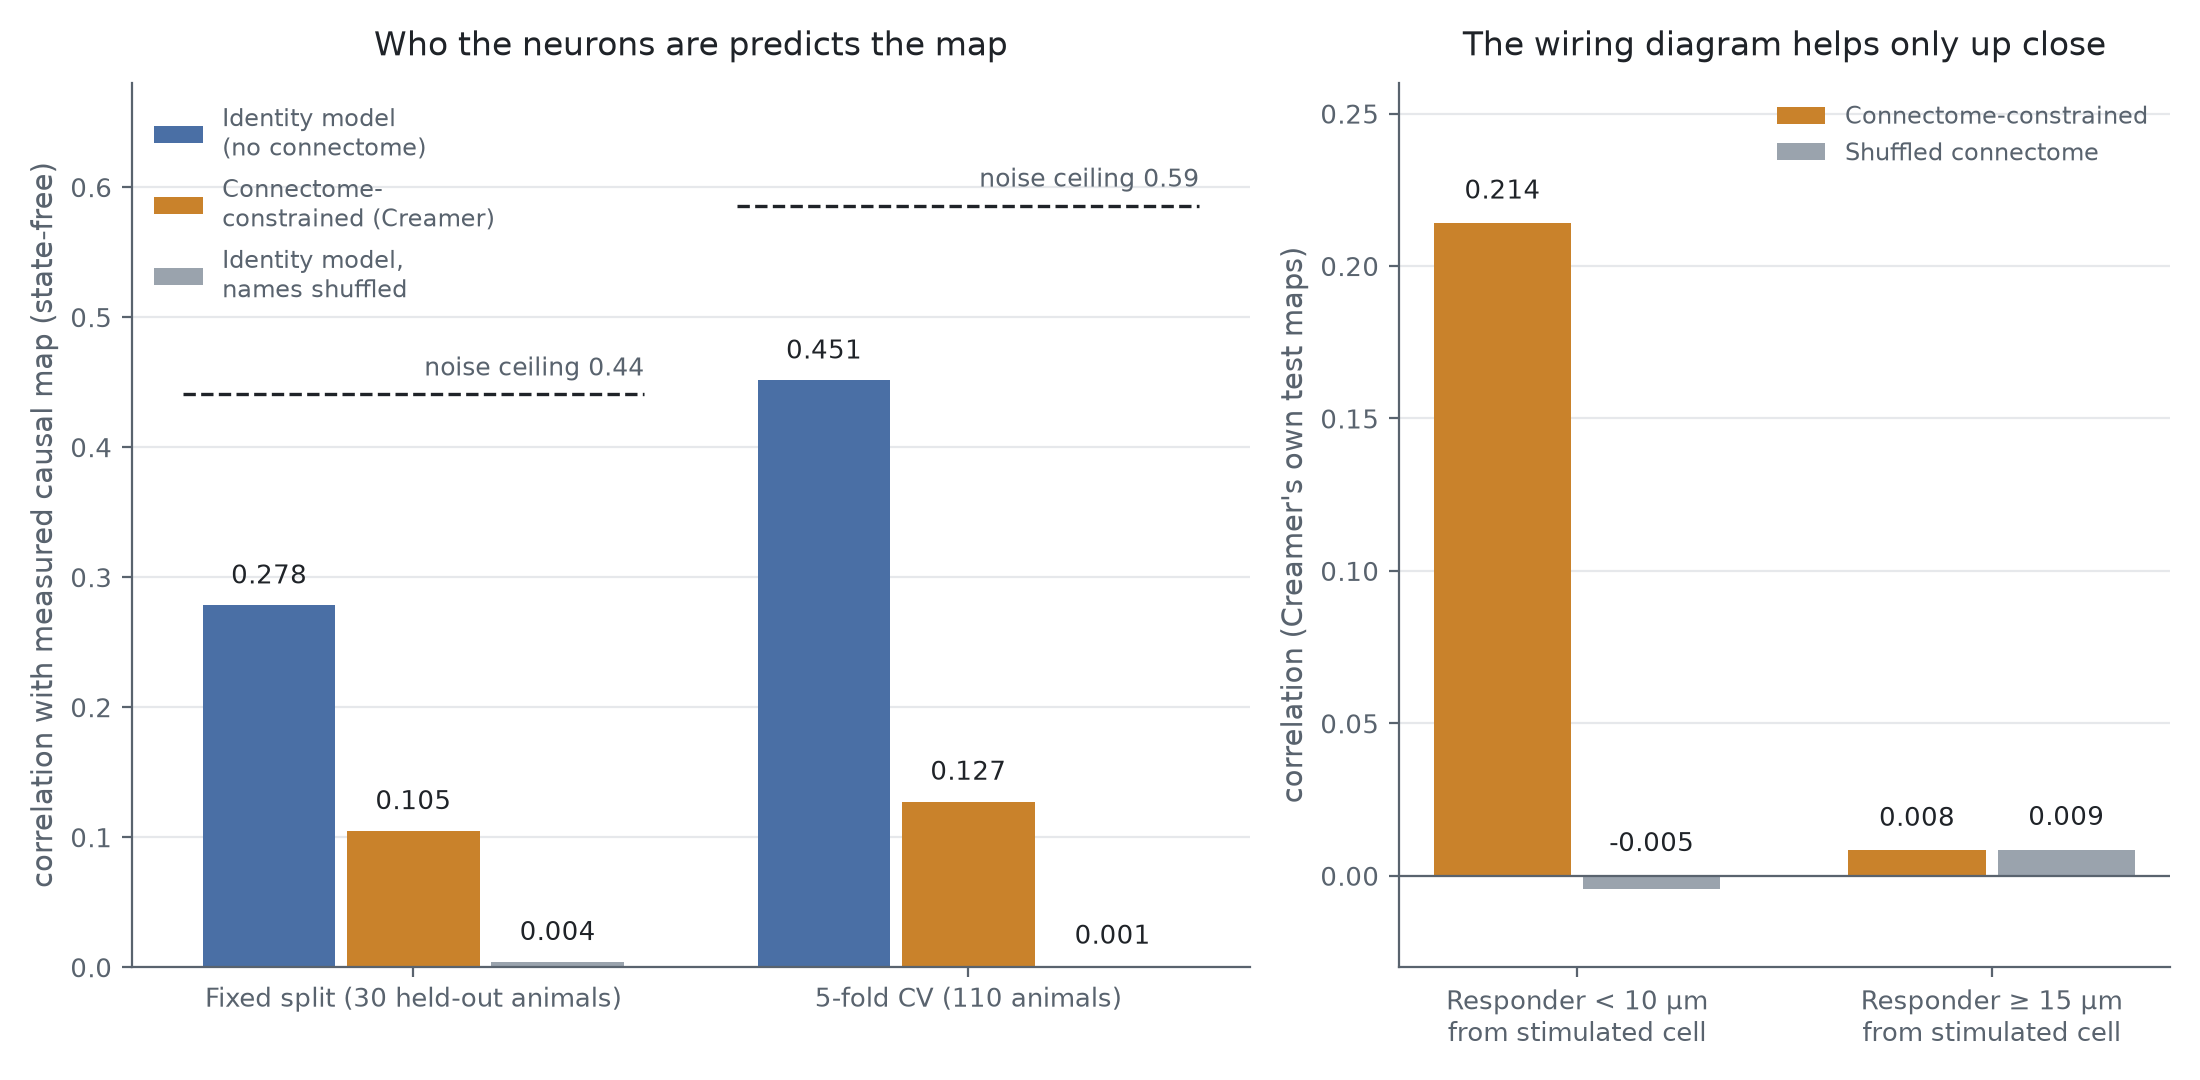
Scored state-free, a model that knows only neuron names predicts most of the reproducible map in unseen animals, and shuffling the names erases it. The connectome model’s advantage over a shuffled connectome sits entirely among close neighbours of the stimulated cell.
Findings and limits
What holds, on this one dataset:
- Identity carries most of the predictable signal. An identity-indexed model with no connectome input predicts held-out animals’ causal maps at 0.451 in 5-fold cross-validation over 110 animals, 77% of the noiseless ceiling (0.586). On a fixed 80/30 split the same kind of model reaches 0.278, 63% of that split’s ceiling (0.44). Shuffled names score about zero in both. The published connectome-constrained model scores 0.105 on the fixed split.
- The connectome’s power is local. Its edge over a shuffled connectome lives within about 10 µm of the stimulated neuron and beats a distance-preserving shuffle there. Far away it predicts nothing, yet the identity model still finds weak, reproducible structure beyond 15 µm.
- For neurons never seen in training, expression profiles and wiring features predict the map about as well as each other (0.137 vs 0.134), both far above random features. An earlier version of this result said expression wins; a second, simpler method turned it into a tie.
What does not hold, or is weaker than it looks:
- My first ceiling results (94% and about 100% of ceiling) were state leakage: the model was forecasting each event’s ongoing dynamics. Every number on this page is state-free, which drops the fixed-split score from 0.413 to 0.278.
- The 77% depends on cross-validation in which a few hyperparameters were chosen on training animals that later land in test folds. The leakage-free fixed split agrees in direction but is lower (63%).
- The comparison with Creamer’s model is not a refit: I scored their published weights, which were fit on a split that overlaps my test animals. That favours their model, but a proper comparison would refit it on my split, which I have not done.
- Knowing the causal map did not help forecast spontaneous activity in new, freely moving worms, at least for linear, class-level forecasts at 2 Hz.
- The anatomy result (nerve-ring membrane contact predicts the map beyond synapses and
cell-body distance; synapses add nothing given contact) is a small effect, partial
correlation 0.04, on two EM contact maps (result file
geometry/results/contact_geometry.json, scriptgeometry/contact_geometry.pyin the private repository). - Roughly 60% of the reliable response looks individual to each worm at the neuron level, but that share falls to about 40% when left/right pairs are merged, so it is a range, not a number.
Open: refit the connectome model on the same split; a dynamical model with coupling restricted to contacting rather than synaptic pairs; and replication on a second perturbation dataset, which does not yet exist publicly.
Scope: this is a reanalysis of public data, not new experiments. The perturbation atlas is Randi et al. (2023); the connectome-constrained model and its metric are Creamer, Leifer and Pillow (2025), whose direction I reproduce (81% of reproducibility, not the reported 92%); expression profiles are CeNGEN (Taylor et al. 2021); spontaneous recordings are Atanas et al. (2023). The contribution is an identity-indexed model compared on the authors’ own estimator, state-free scoring against a noise ceiling, the near-field localization of the connectome’s predictive power, and the record of which of my own conclusions did not survive.