Part of the ANN–BNN series. Project page: Where an inference law lives.
A question that comes up whenever someone plots a loss curve next to a developmental one: does any metric of a network’s training trajectory line up with any curve of brain development? The honest way to ask it is to try all of them at once, with a control that would catch the obvious way to fool yourself, and count. I did that on 11 November as an exploratory battery, with no predictions written in advance, and the count is the post. So is a mistake in the battery’s own shape report, found in review, which changes the description but not the count.
The battery
Fifteen metrics recorded at 40 log-spaced checkpoints over 3,000 training steps: loss, gradient norm, Fisher trace, a plasticity measure (the norm of the parameter change per training step), weight density, weight RMS, weight entropy, dead-unit fraction, intrinsic dimension, participation ratio, code entropy, a mutual-information estimate between representation and target, loss ratio after pruning half the weights, loss flatness, and representation stability. Three substrates: the conditioning-stream transformer and leaky GRU from the first post, and an MLP teacher-student task. Three seeds each. Every run was repeated with shuffled targets, so that a metric’s shape could be charged to learning only if it was absent when there was nothing to learn.
Seven developmental curves, hand-reconstructed from the literature and mapped from age 0 to 20 years onto a unit interval: synaptic density in V1 (Huttenlocher and de Courten, 1987) and in prefrontal cortex (Huttenlocher and Dabholkar, 1997), cortical glucose metabolism (Chugani, 1987), frontal grey-matter volume (Giedd, 1999), white-matter myelination (Lebel, 2008), spine turnover (Holtmaat, 2005; Zuo, 2005), and critical-period plasticity (Hensch, 2005). The network’s time axis was log-rescaled to the same interval. Alignment is a Spearman correlation on 50 resampled points with an AR(1)-surrogate p-value from 2,000 surrogates; a pair counts only if |ρ| exceeds 0.7 with p below 0.05 in every substrate, with the same sign.
The count
Seven of 105 pairs pass. Here they are, with the correlations in the three substrates for the trained runs and for the shuffled-target runs.
| metric | developmental curve | ρ, trained | ρ, shuffled targets | shapes |
|---|---|---|---|---|
| loss | white-matter myelination | −1.00, −1.00, −1.00 | −1.00, −1.00, −0.96 | down vs up |
| loss | spine turnover | 1.00, 1.00, 1.00 | 1.00, 1.00, 0.96 | down vs down |
| weight density | white-matter myelination | 0.97, 0.95, 0.96 | 0.95, 0.96, −0.68 | up vs up |
| weight density | spine turnover | −0.97, −0.95, −0.96 | −0.95, −0.96, 0.68 | up vs down |
| plasticity | critical-period plasticity | 0.98, 0.99, 0.94 | 0.98, 0.99, 0.97 | decay vs early peak |
| loss | critical-period plasticity | 0.91, 0.91, 0.91 | 0.91, 0.91, 0.87 | down vs early peak |
| plasticity | synaptic density, V1 | 0.91, 0.89, 0.87 | 0.90, 0.89, 0.91 | decay vs early peak |
The battery’s own control splits them four and three. Four are flagged: the shuffled-target runs produce the same alignment in all three substrates. The other three the results file labels learning-specific, and the label is a technicality. For the two weight-density pairs, the MLP’s shuffled correlation flips sign to −0.68 while the other two substrates sit at 0.95 and 0.96; for loss against critical-period plasticity the file does not raise the flag, though the shuffled correlations, 0.91, 0.91 and 0.87, are within 0.04 of the trained ones.
And every one of the seven is trivial on inspection. Four are a monotone curve against a monotone curve: loss goes down and myelination goes up, so they anticorrelate at −1.00; loss goes down and spine turnover goes down, so they correlate at 1.00. Any decreasing curve does this against any monotone curve, and the shuffled-target loss decreases too. The other three are a decaying curve, plasticity or loss, against a developmental curve that peaks within the first 13 percent of its range and falls for the rest of it, critical-period plasticity or V1 synaptic density. A decay against the falling limb of an early peak correlates nearly as well as two monotone curves do, and the shuffled-target plasticity decays in the same way.
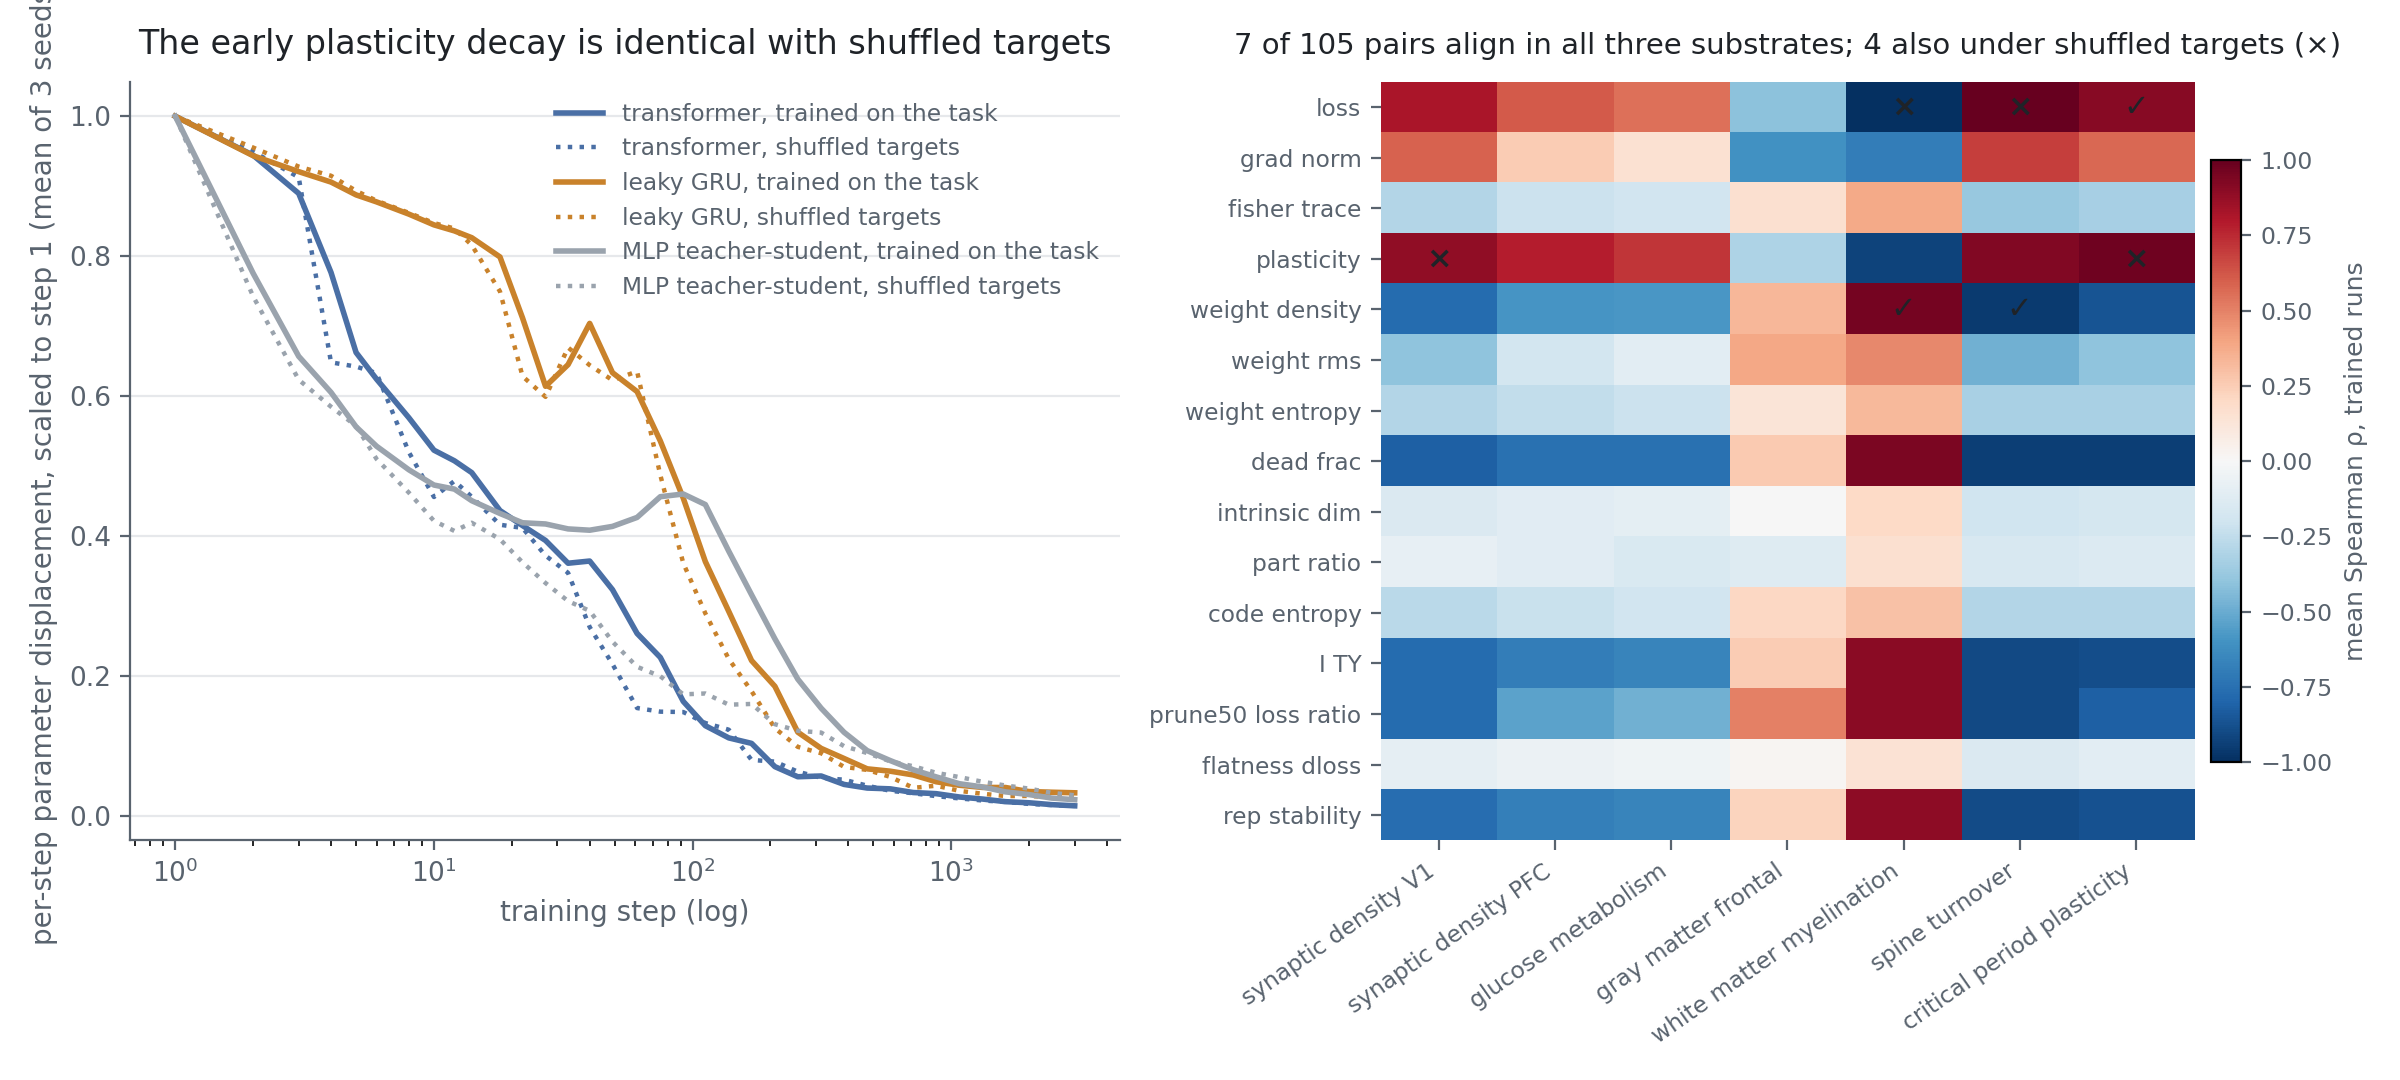
The shape the battery reported, and the shape in the data
The run note for this battery, and the first draft of this post, described the plasticity metric as an early inverted U peaking at 0.07 to 0.09 of log time, in all three substrates and under shuffled targets, and I had read that as an optimiser warm-up. It is not there. The plasticity metric is a change per step, which is undefined at step 0; the battery’s shape classifier filled that missing value with the curve’s mean before classifying, and a curve that begins at its mean, rises to its true first value and then falls reads as an inverted U with a peak at the first real sample. Dropping the undefined point, every one of the six curves (three substrates, trained and shuffled) has its maximum at step 1 (0.33 for the transformer, 0.14 for the GRU, 0.07 for the MLP) and decays from there with no later peak. The first update is the largest per-step displacement of the parameters, and the displacement shrinks thereafter, whether or not the targets carry information. The figure, which drops step 0, always showed that; its first title did not.
The correction leaves the count where it was. The two plasticity pairs pass because a decay matches the falling limb of an early-peaked curve, and they pass under shuffled targets for the same reason. What it removes is a mechanism I should not have offered.
What the substrates disagree on
The metrics that might have carried a learning-specific developmental shape disagree with each other across substrates, which under the all-substrates rule means they cannot pass. The Fisher trace has an inverted U on the transformer only (peak at 0.27 of log time); on the GRU and the MLP it rises monotonically. Intrinsic dimension rises on the transformer and the GRU and falls on the MLP. The dead-unit fraction falls on the first two and rises on the MLP. The participation ratio rises, is U-shaped, and falls respectively. A metric whose direction depends on the architecture is not a candidate for a universal developmental alignment, whatever it does on one network.
The verdict, labelled
No learning-specific, substrate-general alignment between a training-trajectory metric and a developmental curve on this battery. The instrument label matters: hand-reconstructed curves, a log-time axis chosen by me, 3,000 steps, three small networks. A different time mapping or a larger model could change individual cells. What it would not change is the lesson about the control. Developmental curves are mostly monotone or single-peaked; training metrics are mostly monotone or decaying; two monotone curves correlate at ±1 by construction, and a decay against an early peak nearly so. Without a shuffled-target run beside every trained run, a battery like this would have reported seven alignments and a paper.
The warning applies beyond networks. The developmental myelination schedule that my autism and myelination timing work leans on is a monotone curve of this kind, and any claim that a model trajectory tracks it needs the same control before the correlation means anything.